Know where the fish are before you leave the dock.
A predictive fishing heat map for the Pacific coast of Nicaragua, Costa Rica and Panama — every target from sailfish to snook, scored every morning from live satellite and ocean-model data, across 24 ports.
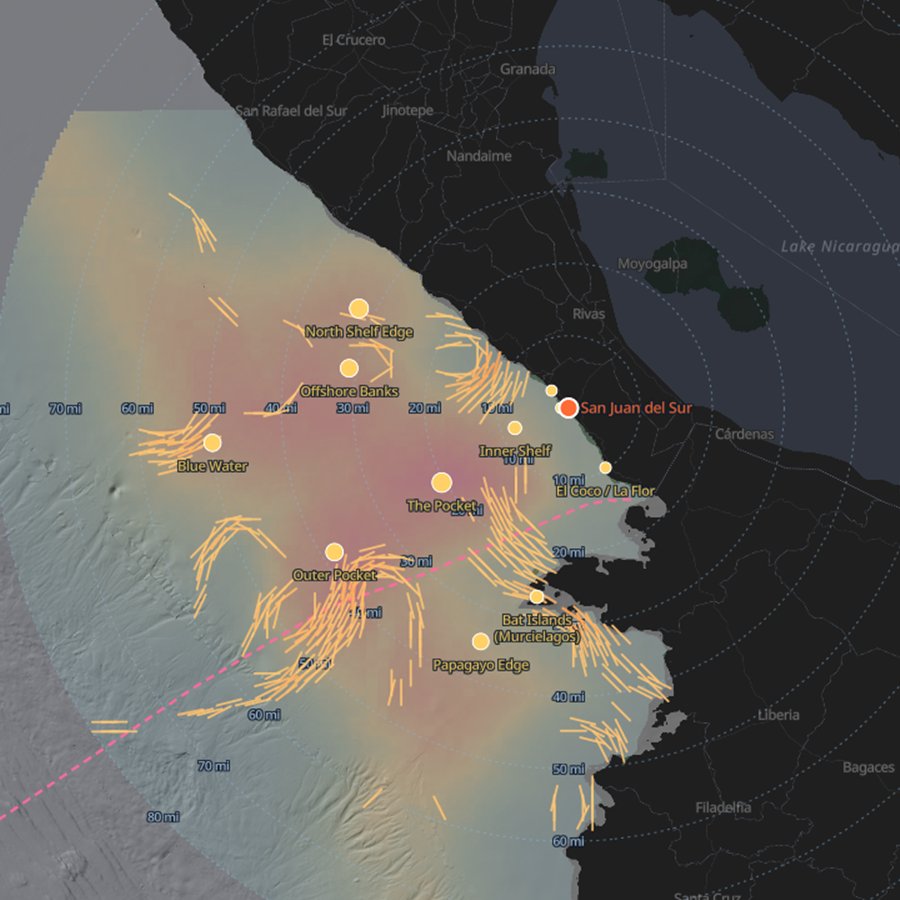
One map, eleven ways to read the water
Sailfish don't feed where snook feed. Every species gets its own scored map — sailfish, marlin, yellowfin, mahi, wahoo, roosterfish, cubera, snook, sierra mackerel, a spearfishing layer, and a combined view when you just want the best answer.
Temperature breaks & currents
Auto-detected SST breaks — the edges bait stacks on — with live surface currents drawn over the heat, so you can see the conveyor belts.
The vertical picture
A measured thermocline with a five-day forecast, and the oxygen ceiling — how much fishable water the column actually holds today.
Departure windows
Dawn-out and afternoon-back legs rated go / marginal / no-go against a panga's real limits, three days ahead, from a multi-model wind consensus.
Tides & bite times
Tide stage and turns, solunar majors and minors, and the incoming-tide bite wired straight into the snook score.
On the water
GPS track recording, waypoints, a photo catch log, anchor-drag alarm, back-to-port bearing and daylight countdown — the safety tools are free, always.
History playback
Scrub back through archived days — SST, heat, currents and conditions — and watch how the water that produced fish set up.
See it read the water
Thirty seconds of the live app: the same morning scored for yellowfin, mahi, roosterfish and the combined view — watch the answer move offshore and back inshore as the species changes.
How it works
Satellites & models overnight
NOAA sea-surface temperature, Copernicus subsurface and altimetry, Open-Meteo wind and marine forecasts — fetched and quality-checked daily.
Your water, scored
The grid around your home port is scored per species: temperature preference, fronts, structure, depth, season and climate state.
Pick a species and go
Open the map, tap your target, read the ranked best bets — heading, distance and why. Share the plan with the crew in one tap.
Free to start. Pro for every species.
The iPhone app is free to download and free to use, with no account to create. Pro is a subscription through the App Store.
Free
- Every port and the daily heat map
- Sailfish, roosterfish, mahi and the Combined view
- Tides, bite times and today's surf
- Catch log, track recording, 5 waypoints and the top best bet
- Anchor alarm, back-to-port bearing and daylight countdown: free, always
Pro
- Every species, not just four
- Temperature breaks and surface currents
- Ocean colour and the SST layers
- The full ten-day wind and wave forecasts
- Surf ten days out, every peak, the energy graph and the satellite beach map
- Departure and run planners
- Scrub back through archived days
- Export tracks as GPX, KML or GeoJSON
- Unlimited waypoints and the full best-bet ranking
Prices in US dollars; the App Store shows yours. Payment is charged to your Apple Account. Pro renews automatically unless auto-renew is turned off at least 24 hours before the end of the period. Manage or cancel any time in your Apple Account settings.
Fishing Nicaragua, Costa Rica or Panama?
Bluewater IQ is on the water now with local captains, from Corinto to the Gulf of Panama. Free to start — every port, the daily map and your catch log, with no account to create.